Financial health is a cornerstone for the success of any business, especially in industries like construction, where project timelines, cash flow, and operational efficiency play significant roles in determining profitability. To effectively monitor and optimize these critical areas, understanding and utilizing financial ratios is essential.
Financial ratios provide key insights into a company’s performance, helping businesses make informed decisions about their future. Whether you're assessing short-term liquidity or long-term profitability, these ratios enable business owners, investors, and managers to evaluate the true financial condition of a company.
In this guide, we will explore the core financial ratios that every business leader should understand, especially those in the construction sector. By analyzing these ratios, you can spot red flags early, fine-tune your strategy, and position your company for long-term success.
What Is a Financial Ratio?
A financial ratio is a numerical comparison of two or more pieces of financial data derived from a company’s financial statements. These ratios help assess various aspects of a business’s financial performance, including profitability, liquidity, and operational efficiency.
At its core, financial ratio analysis is an effective way to measure a company’s overall financial health. Through this process, business owners can gauge how well their company is performing in specific areas such as debt management, asset utilization, and profit generation.
Financial Ratio Formulas provide a foundation for this analysis. Each ratio is calculated by dividing one financial figure by another. This gives a snapshot of the business’s ability to meet obligations, generate profit, and utilize its assets. The results are especially valuable when benchmarked against industry standards or compared to past performance.
For construction businesses, financial ratio analysis and interpretation are critical in navigating the complex financial landscape of project management. By consistently monitoring these ratios, companies can make more
strategic decisions regarding project bidding, financial management, and resource allocation.
Key Financial Ratios by Category
When assessing the financial health of a business, especially in construction, different categories of ratios provide insight into specific aspects of performance. These ratios can help identify whether a company is maintaining financial stability, growing profitability, or facing potential risks. The key categories of financial ratios include liquidity, solvency, efficiency, profitability, and project‑specific ratios. Let’s break each category down and explore its relevance to your business.
Liquidity Ratios – Financial Ratios Formulas
Liquidity ratios are crucial for understanding a company’s short‑term financial health, particularly its ability to meet immediate obligations like bills and supplier payments. Construction companies often face fluctuations in cash flow due to project delays and extended receivable cycles, making liquidity management even more critical.
Current Ratio
Formula: Current Assets ÷ Current Liabilities
A current ratio above 1 suggests that a company has enough assets to cover its liabilities. For construction businesses, a ratio around 1.4 to 1.6 is typically considered healthy, reflecting a balance between available assets and liabilities. However, if the ratio is too high, it could indicate inefficient use of assets or idle capital.
A low current ratio (under 1) signals potential cash flow problems, where a company may struggle to pay its bills when due. On the other hand, a ratio too high could mean that assets are not being used efficiently to generate revenue, which could hinder growth.
Quick Ratio / Acid‑Test Ratio
Formula: (Cash + Accounts Receivable) ÷ Current Liabilities
This ratio excludes inventory and focuses on the company’s ability to cover short‑term liabilities with its most liquid assets. In construction, where equipment and materials are often tied up in long‑term projects, the quick ratio gives a clearer picture of immediate financial flexibility.
If the quick ratio is too low, it may indicate that the company is overly reliant on assets that can't be quickly converted to cash. A higher ratio, while reassuring, could also point to inefficiencies in asset utilization.
Working Capital Ratio / Turnover
Formula:
Working Capital Ratio: Current Assets − Current Liabilities
Working Capital Turnover: Revenue ÷ Working Capital Ratio
This ratio reveals how efficiently a company uses its working capital to generate revenue. A high turnover ratio can indicate that the company is effectively converting its available resources into sales, but if it's excessively high, it might suggest under‑capitalization and potential risks in maintaining operations.
Efficient working capital management ensures that a construction business can cover both ongoing project costs and operational expenses without overextending itself.
In the 2024 results from the Construction Financial Management Association (CFMA) Financial Benchmarker, the median debt‑to‑equity ratio for respondents improved to 1.2 in 2021 (from 1.4 in 2020)[?].
Solvency & Leverage Ratios – Financial Ratios Formulas
Solvency ratios assess a company’s long‑term financial stability and its ability to manage debt. These ratios are vital for construction businesses, which often require substantial financing for large‑scale projects and equipment investments.
Debt‑to‑Equity Ratio
Formula: Total Liabilities ÷ Equity
This ratio compares a company’s total debt to its equity, showing how much of the business is financed through debt. A ratio under 2.0 to 3.0 is generally considered manageable for construction companies. Although it can vary depending on the company’s capital structure and the size of its projects.
High debt compared to equity can increase financial risk, particularly in industries like construction, where project revenues can fluctuate. Companies with a high debt‑to‑equity ratio may struggle to service debt during lean periods.
Interest Coverage Ratio
Formula: EBIT (Earnings Before Interest and Taxes) ÷ Interest Expense
This ratio measures how easily a company can meet its interest obligations. In construction, where financing costs can be significant, this ratio indicates whether the business can comfortably cover interest payments from its operational earnings.
A low interest coverage ratio suggests that the company may be at risk of not being able to service its debt, particularly if cash flows fluctuate or if project timelines extend.
Leverage Ratio (Assets to Net Worth)
Formula: Total Assets ÷ Net Worth
This ratio compares the company’s total assets to its equity, showing how much of its assets are funded by debt. A higher ratio means more debt is being used to finance assets, which can be risky in a capital‑intensive industry like construction.
While leveraging debt can fuel growth, excessive leverage may put the company at risk, especially during periods when cash flow is uncertain or when projects face delays.
According to the CFMA’s "Key Metrics for Measuring Financial Health" article, a current ratio should always exceed 1.25, and a quick ratio should always exceed 1.0 in a sound construction company[?].
Efficiency Ratios – Financial Ratios Formulas
Efficiency ratios help measure how effectively a company utilizes its assets and working capital to generate revenue. For construction companies, improving operational efficiency is essential to maintaining profitability and controlling costs.
Working Capital Turnover
Formula: Revenue ÷ (Current Assets − Current Liabilities)
This ratio shows how efficiently the company uses its working capital to generate sales. A higher ratio indicates that the company is able to generate more revenue per dollar of working capital. However, an excessively high ratio may indicate that the company is operating with too little working capital, which could lead to financial strain.
Efficient use of working capital is crucial for construction businesses, which often face cash flow issues due to long project cycles.
Equity Turnover
Formula: Revenue ÷ Equity
This ratio measures how effectively the company is using its owner’s equity to generate revenue. In a growth phase, equity turnover is a key indicator of how well investments in the company’s growth are being utilized.
For construction businesses, this ratio helps assess whether the equity invested in the company is producing adequate returns or if more capital is needed to sustain growth.
Asset Turnover / Fixed Asset Utilization
Formula: Revenue ÷ Total Assets
This ratio measures how efficiently the company uses its long‑term assets, such as machinery, vehicles, and equipment, to generate revenue. In asset‑intensive industries like construction, this ratio is particularly important for evaluating how effectively the business is leveraging its equipment and infrastructure.
Efficient asset utilization helps minimize costs and improve profitability, especially in construction, where heavy investments in equipment are common.
Days Receivables & Days Payables
Formula:
Days Receivables=Accounts Receivable÷Net Credit Sales×Number of Days
Days Payables=Accounts Payable÷Cost of Goods Sold (COGS)×Number of Days
These ratios measure how long it takes for a company to collect payments from customers and how long it takes to pay its suppliers. Efficient management of these periods ensures that a business can maintain liquidity and
avoid cash flow bottlenecks.
Long days receivables can indicate cash flow issues, while delayed payables may strain supplier relationships, both of which can disrupt project timelines.
In the CFMA‑based article on the 2024 Financial Benchmarker, construction firms reported average days in accounts receivable of 56.6 days in 2023, down from 58.7 days in 2022 — indicating improved collection efficiency[?].
Profitability Ratios – Financial Ratios Formulas
Profitability ratios evaluate how effectively a business generates income relative to revenue, assets, or equity. In the construction industry, they reveal whether projects and operations are producing sustainable returns despite fluctuating material costs, labour expenses, and
project delays.
Gross Profit Margin
Formula: (Revenue − Cost of Goods Sold) ÷ Revenue × 100
This ratio measures how efficiently a company turns revenue into profit after accounting for direct project costs. A higher margin indicates better control over job costs such as labour, materials, and subcontractors.
For construction companies, consistent monitoring of gross profit margins across projects helps identify
cost overruns early and highlights which types of projects deliver the best returns.
Net Profit Margin
Formula: Net Income ÷ Revenue × 100
Net profit margin reflects the overall profitability after all expenses, including overhead, taxes, and interest. It’s a crucial indicator of how much profit the company retains from each dollar earned.
A falling net margin can signal increasing operational inefficiencies, rising input costs, or pricing pressure in bids.
Return on Assets (ROA)
Formula: Net Income ÷ Total Assets × 100
ROA shows how efficiently a company uses its assets to generate profit. Construction firms that invest heavily in machinery and equipment must ensure these assets are being utilized to their full potential.
A low ROA may suggest idle equipment or poor project utilization, while a high ROA indicates strong asset productivity.
Return on Equity (ROE)
Formula: Net Income ÷ Shareholders’ Equity × 100
ROE measures how effectively the company is using investors’ capital to generate profit. In construction, a healthy ROE demonstrates that management is using retained earnings and owner investments wisely to fund profitable projects.
A declining ROE might indicate shrinking profitability or inefficient capital deployment.
Tracking profitability ratios over time gives construction managers the insight needed to adjust pricing strategies, optimize costs, and focus on high-margin project types.
Project and Pipeline Ratios – Construction Ratios Formulas
Beyond standard financial metrics, project-specific ratios give construction businesses a clearer view of performance at both the job and portfolio levels. These ratios tie financial outcomes directly to project management efficiency.
Earned Value (EV) and Cost Performance Index (CPI)
Formulas:
Earned Value (EV): % of Work Completed × Budget at Completion (BAC)
CPI: EV ÷ Actual Cost (AC)
Earned value metrics compare budgeted versus actual progress to assess whether a project is on track.
A CPI > 1 indicates the project is under budget, while a CPI < 1 signals overspending. Regular tracking of earned value helps project managers control costs and forecast completion more accurately.
Schedule Performance Index (SPI)
Formula: EV ÷ Planned Value (PV)
The SPI measures how efficiently the project is adhering to its planned timeline.
An SPI greater than 1 shows work is ahead of schedule, while below 1 indicates delays. For construction firms managing multiple projects, this ratio helps prioritize resources and mitigate timeline risks.
Backlog Ratio
Formula: Backlog Revenue ÷ Annual Revenue
The backlog ratio reflects how much future work a company has secured relative to its current annual revenue.
A higher backlog ratio suggests strong demand and stable future cash flow, but if it’s too high, it could strain operational capacity and resource allocation.
Bid-to-Win Ratio
Formula: Number of Won Projects ÷ Number of Bids Submitted × 100
This ratio indicates the success rate of your bidding process. A low ratio might point to pricing or competitiveness issues, while a high ratio shows effective estimation and client targeting.
Monitoring bid-to-win ratios helps construction firms fine-tune bidding strategies and focus efforts where they yield the best returns.
Together, these project and pipeline ratios provide a comprehensive lens into operational performance, ensuring that each project contributes positively to the company’s long-term financial health.
Prevent cost overruns
Register expenses in FirstBit ERP
Request a demo
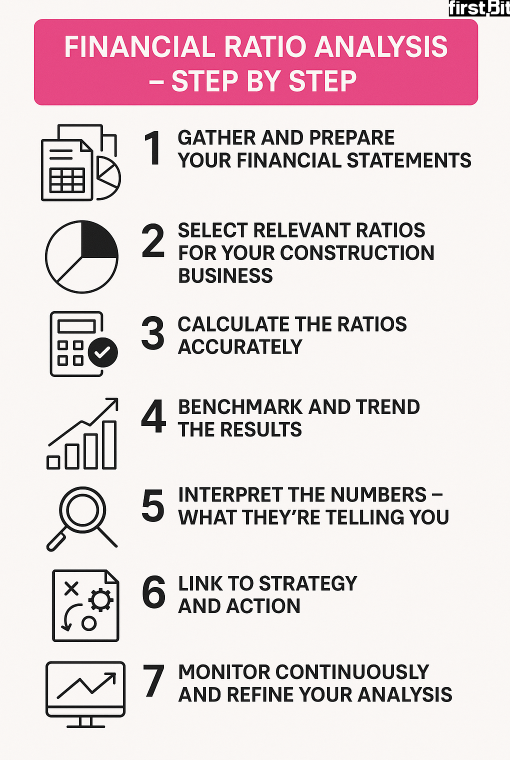
Financial Ratio Analysis – Step by Step
Steps for Financial Ratio Analysis
To turn ratios into action, you’ll want a structured process. Here are the steps you should follow to conduct a financial ratio analysis. In this guide, we primarily focus on doing it manually, using your own observational skills. However, financial ratio analysis can also be conducted through machine learning, utilizing AI techniques
[?].
Step 1: Gather and Prepare Your Financial Statements
Ensure you have complete, up‑to‑date financial statements: a balance sheet, an income statement, and a cash‑flow statement. In construction, account for project-specific factors (under‑billings, change orders, work‑in‑progress). Accuracy at this stage matters.
Step 2: Select Relevant Ratios for Your Construction Business
Not every ratio is equally relevant for every company. Use the “5 types of financial ratios” (liquidity, solvency/leverage, efficiency, profitability, project/pipeline) to pick those that align with your business size, growth stage, project mix, and strategic focus.
Step 3: Calculate the Ratios Accurately
Calculate each ratio using financial ratios formulas with consistent definitions for numerator and denominator (e.g., ensuring assets and liabilities are defined the same across periods). Tailor as needed for the construction context (e.g., exclude non‑recurring items, normalize for the project cycle).
Step 4: Benchmark and Trend the Results
Compare your computed ratios against:
For example, if your current ratio is 0.9 but the industry median is 1.4, that suggests a liquidity concern.
Step 5: Interpret the Numbers – What They’re Telling You
Here you move beyond numbers into explanation:
A low current ratio (<1.0) may signal imminent cash stress.
A very high working‑capital turnover may reflect under‑capitalisation and risk.
A declining asset turnover may signal ageing equipment or under‑utilised capacity.
You’ll want to look for signs of both risk and opportunity.
Step 6: Link to Strategy and Action
Key financial ratios should drive decisions: adjust bidding strategy if gross margins shrink, renegotiate payment terms if days receivable grow, or invest in productivity tools if labour utilisation lags. Your ratio framework becomes a management tool, not just a reporting exercise.
A study that analyzed nearly 1,300 construction firms found that using benchmark financial ratios can help companies “right-size” their organizations and make better financial management decisions[?].
Step 7: Monitor Continuously and Refine Your Analysis
Financial ratio analysis is not a one‑time exercise. Review it monthly or quarterly, maintain a dashboard, and refine the set of ratios as your business evolves. Common pitfalls: stale data, ignoring context (industry cycles, materials price spikes), or over‑relying on one ratio in isolation.
FirstBit ERP: Mastering Construction Financial Ratios for Smarter Project Control
FirstBit ERP helps construction businesses manage and optimize key financial ratios, enabling better decision-making and improved project control.
1. Real-Time Data for Accurate Ratios
FirstBit ERP integrates real-time data from accounting, procurement, and project management, ensuring that financial ratios like current ratio or debt-to-equity are based on up-to-date, accurate information.
2. Customizable Dashboards
With customizable financial dashboards,
FirstBit ERP allows you to track liquidity, profitability, and solvency ratios across projects, helping you quickly identify trends or discrepancies.
Dashboard in FirstBit ERP
3. Project-Specific Financial Tracking
FirstBit ERP tracks project-specific ratios, such as earned value and percent complete, so you can monitor individual project performance and financial health.
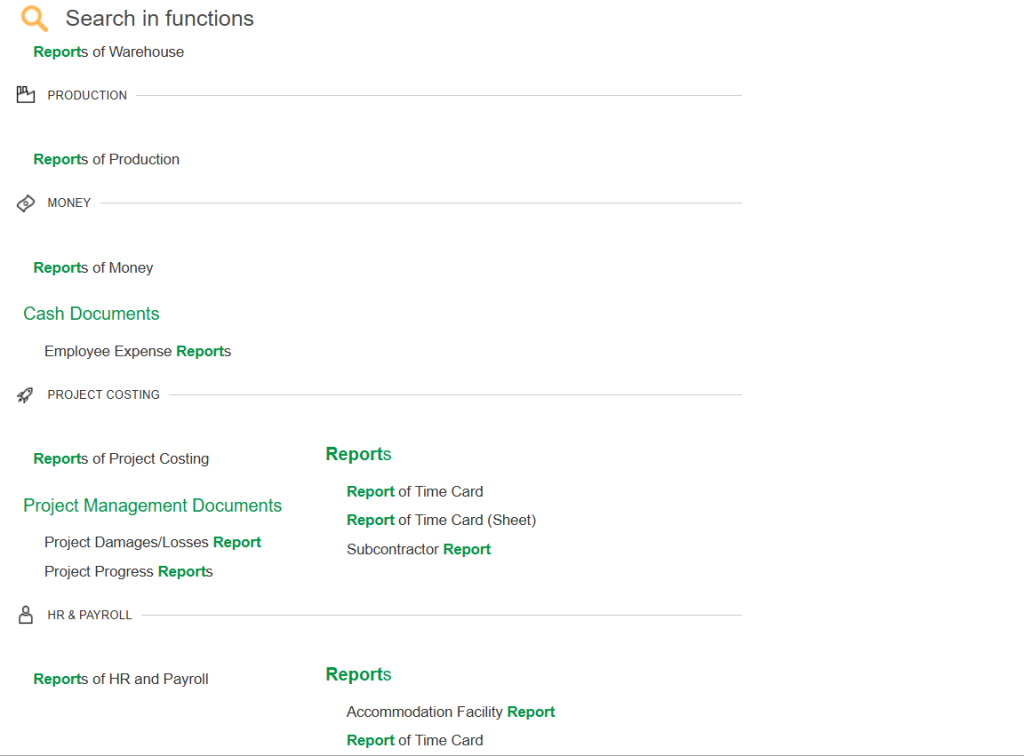
4. Automated Financial Reporting
The system automates financial reporting, saving time on manual calculations and providing consistent, standardized data to compare against historical or industry benchmarks.
Types of reports in FirstBit ERP
5. Seamless Integration with Project Management
FirstBit ERP integrates accounting and project management, providing a clear view of how project performance impacts overall financial health, with real-time updates and automated reports.
6. Informed Decision-Making
By analyzing key financial ratios,
FirstBit ERP helps you make informed decisions. For example, if your debt-to-equity ratio is too high, it can suggest areas for improvement, like refinancing or adjusting project funding.
Keep every project on budget
Request a demo


'%3e%3cg%20clip-path='url(%23clip1_6548_6055)'%3e%3cpath%20d='M13.974%2015.6195C14.2724%2016.0185%2014.6532%2016.3487%2015.0905%2016.5876C15.5278%2016.8265%2016.0114%2016.9686%2016.5084%2017.0042C17.0055%2017.0398%2017.5043%2016.9681%2017.9712%2016.7939C18.4381%2016.6198%2018.8621%2016.3472%2019.2143%2015.9948L21.2994%2013.9098C21.9324%2013.2544%2022.2827%2012.3766%2022.2747%2011.4654C22.2668%2010.5543%2021.9014%209.68269%2021.257%209.03839C20.6127%208.39408%2019.7412%208.02862%2018.83%208.0207C17.9189%208.01278%2017.0411%208.36305%2016.3857%208.99606L15.1902%2010.1845M16.754%2014.2295C16.4555%2013.8305%2016.0747%2013.5003%2015.6374%2013.2614C15.2002%2013.0225%2014.7166%2012.8804%2014.2196%2012.8448C13.7225%2012.8092%2013.2237%2012.8809%2012.7568%2013.0551C12.2899%2013.2292%2011.8659%2013.5018%2011.5136%2013.8542L9.42861%2015.9392C8.7956%2016.5946%208.44534%2017.4724%208.45326%2018.3836C8.46117%2019.2947%208.82664%2020.1663%209.47094%2020.8106C10.1152%2021.4549%2010.9868%2021.8204%2011.898%2021.8283C12.8091%2021.8362%2013.6869%2021.4859%2014.3423%2020.8529L15.5308%2019.6645'%20stroke='%235F7896'%20stroke-width='1.39002'%20stroke-linecap='round'%20stroke-linejoin='round'/%3e%3c/g%3e%3c/g%3e%3crect%20x='0.438953'%20y='0.438953'%20width='28.9709'%20height='28.9709'%20rx='14.4855'%20stroke='%235F7896'%20stroke-width='0.877907'/%3e%3cdefs%3e%3cclipPath%20id='clip0_6548_6055'%3e%3crect%20width='29.8488'%20height='29.8488'%20rx='14.9244'%20fill='white'/%3e%3c/clipPath%3e%3cclipPath%20id='clip1_6548_6055'%3e%3crect%20width='16.6802'%20height='16.6802'%20fill='white'%20transform='translate(7.02344%206.58435)'/%3e%3c/clipPath%3e%3c/defs%3e%3c/svg%3e)